DISTRIBUTION OF INVASIVE JAPANESE BARBERRY AND MULTIFLORA ROSE IN CONNECTICUT
 |
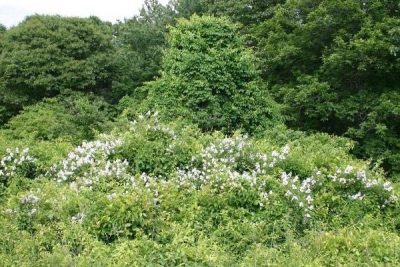 |
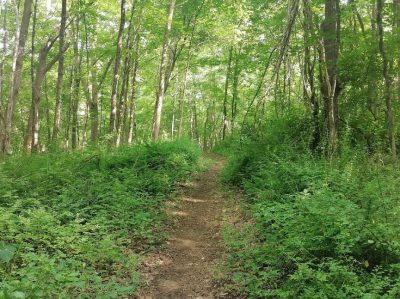
| Forest infested with Japanese barberry | Forest infested with Multiflora rose
(Photo: Leslie Mehrhoff, University of Connecticut, Bugwood.org) |
Invasive plant species are a major threat to Connecticut forests and therefore, accurate mapping and continuous monitoring of invasive species are crucial for the forest health. This study develops a method to understand the distribution of the invasive Japanese barberry (Berberis thunbergii) and Multiflora rose (Rosa multiflora), which are priority species in the invasive plant species list. The study utilizes early spring satellite images of Sentinel–2 (10 × 10 m resolution) from 2016 to 2022. Invasive species show an extended leaf phenology, which allows us to identify the distribution by analyzing the normalized difference vegetation index (NDVI), one of the strong indicators that is useful to understand the plant leaf chlorophyll activity.
| 2019 | 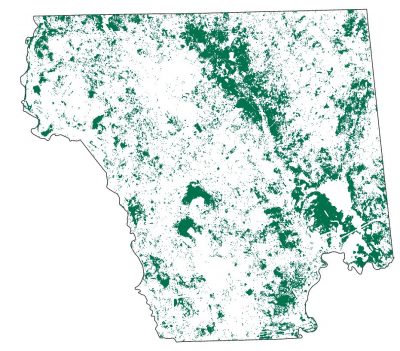 |
 |
 |
| 2021 | |
 |
 |
| Early March (Evergreens) | Mid March | Early April |
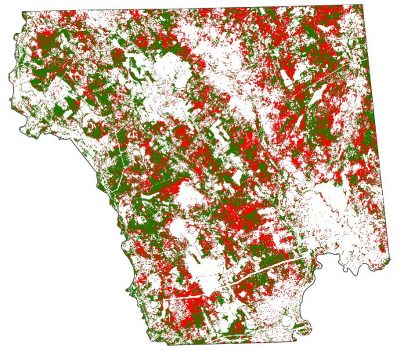
Changes in NDVI values of forest pixels located in Mansfield, Connecticut (2019 and 2021)
 |
 |
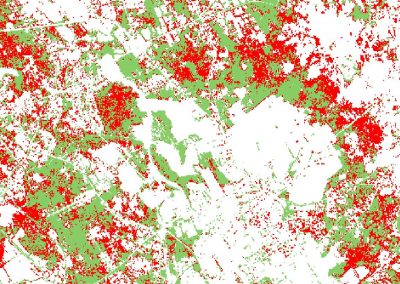 |
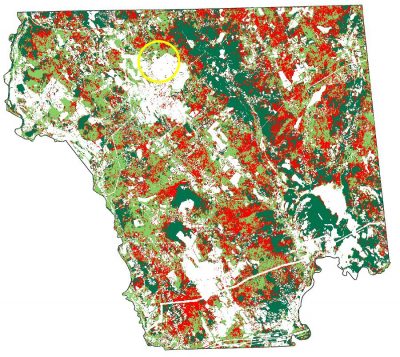
| Area marked in yellow is the Horesban hill, UConn. | Mid March – 2019 | Early April – 2019 |
Changes in NDVI values around Horseban Hill, UConn main campus, Storrs during the early spring period in 2019 (pixels in red are higher NDVI values identified). The area emphasized has ground truth evidences of Japanese Barberry infestation.
In 2023:
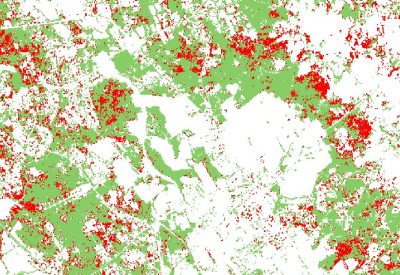
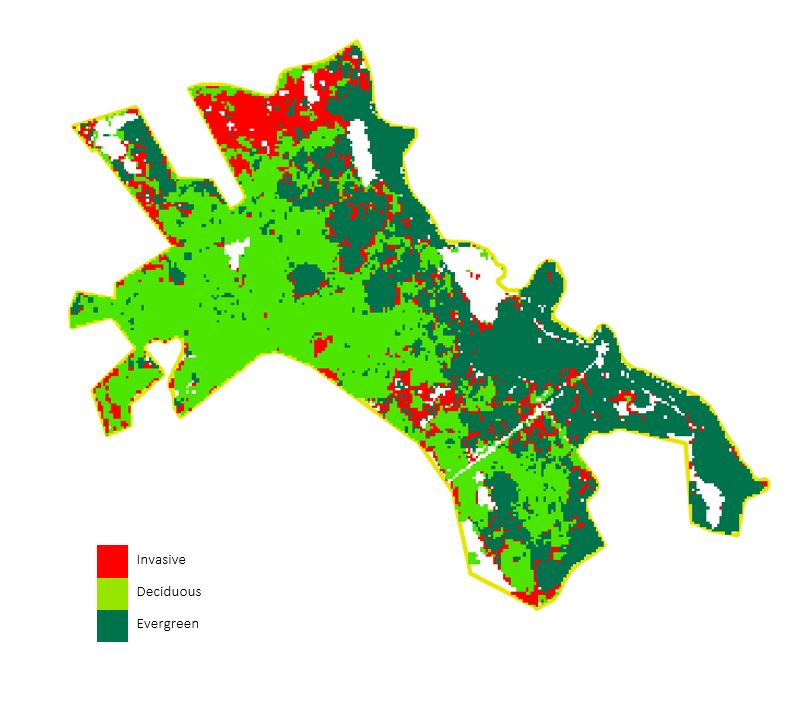
In highlighting the progress of the project, we were able to project the probability pixels which are highly susceptible to being infested by Japanese Barberry and/or Multiflora Rose. The maps can be further improved by validating the Sentinel-2-derived distribution maps with occurrence data gathered from community participation platforms. Removing more false positives and resampling the map products to a meaningful resolution will provide great advantages in pest and invasive plant management efforts.
 |
 |
|
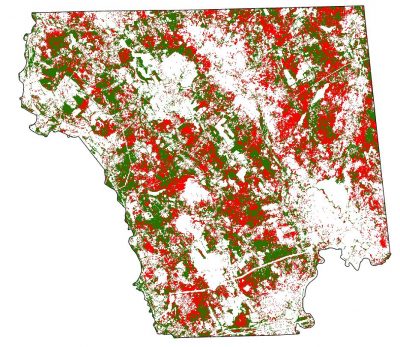
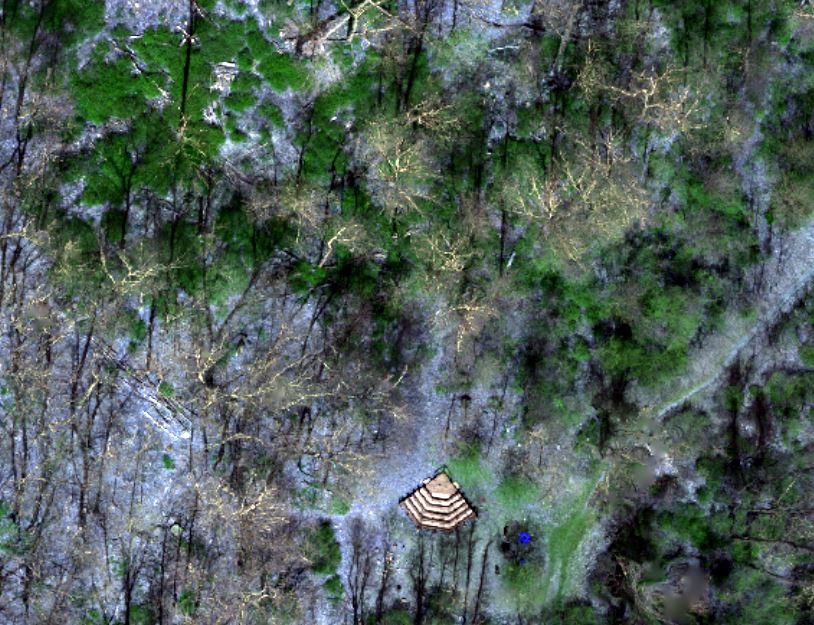
| A drone image of extended plant leaf phenology of two focal understory plants captured in late March 2023, Plot location 10 and 11. UConn Forest, Storrs. | Distribution maps of probability pixels 10m by 10m resolution, Early Spring 2023 |
CONNECTICUT SURFACE WATER CLARITY ASSESSMENT (MULTI-TEMPORAL ASSESSMENT OF CONNECTICUT LAKE WATER CLARITY)
The goal of this project was to have a complete assessment of Connecticut’s lakes. Using satellite imagery provides a big picture of statewide lake and pond water quality by enhancing in situ measurements.
To enhance the in situ data, an assessment of lake water clarity at the state level from available Secchi Disk Transparency (SDT) data and Landsat satellite imagery from 2015 – 2020 was used. Secchi Disk Transparency (SDT) results serve as an indirect measure of a lake’s trophic state. Then the data was directly compared to the information collected by the satellite imagery.
Landsat imagery was used to identify water and other land cover pixels. Water pixels are spectrally unique from most other land cover features, and were identified in this process. Groups of pixels were specified and labeled into water or non-water categories. The clusters of pixels were recoded into non-water (class 0) and water (class 1). A clump process is applied to the water pixels to identify groups of adjacent water pixels which represent waterbody features. Water clumps less than 3 acres in area are sieved from the clump layer to produce a feature layer of waterbodies greater than three acres. This waterbody feature layer is used to extract water pixels from the original Landsat image which is then used in the regression model process.
 |
 |
 |
 |
 |
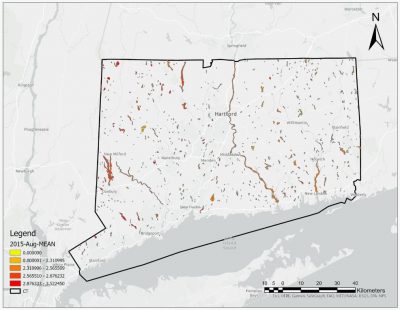
Changes in temporal estimates of statewide lake water clarity (2015-2019)
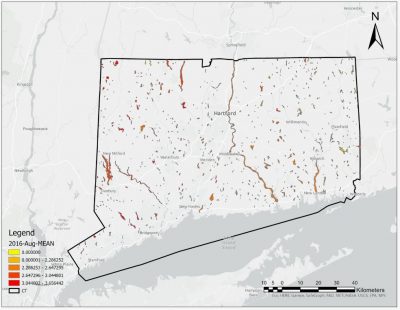
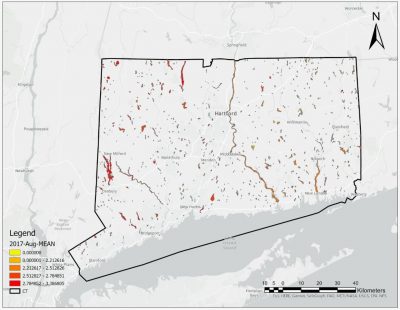
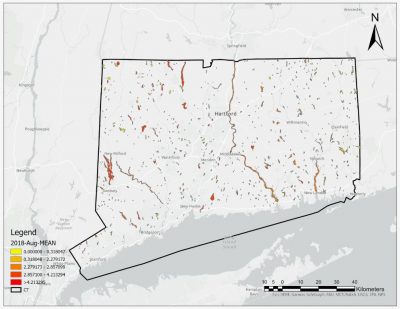
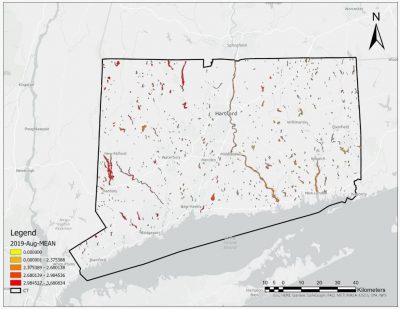
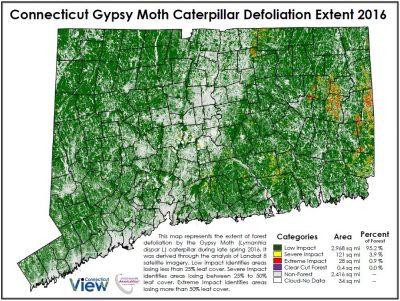
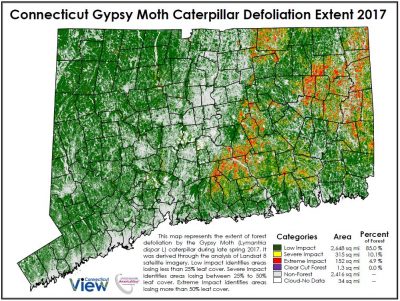
CONNECTICUT GYPSY MOTH CATERPILLAR DEFOLIATION ANALYSIS 2016-2018
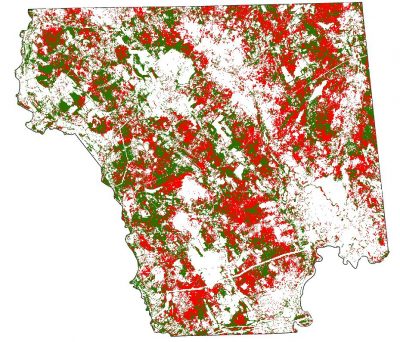
Below are the results of analysis conducted by ConnecticutView researchers that examined the extent of Gypsy Moth caterpillar forest defoliation for the years 2016, 2017, and 2018. The analysis is based on the comparison of the difference between Enhanced Vegetation Index (EVI) images derived from Landsat 8 and Sentinel-2 satellite imagery. The base EVI image was derived from 2015 Landsat 8 imagery. The 2016 EVI image used to compare to the base 2015 EVI image was derived from Landsat 8. The 2017 and 2018 EVI images used to compare with the 2015 EVI were derived from Sentinel-2. Resulting images are 10-meter spatial resolution. Low Impact forest are estimated to have lost less than 25% of leaf cover. Severe Impact forest are estimated to have lost 25% – 50% leaf cover. Extreme Impact forest are estimated to have lost over 50% leaf cover. Maps and image data can be downloaded by clicking the links below.
 |
 |
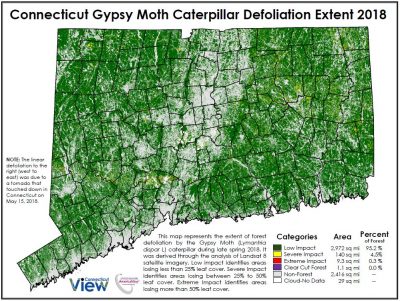 |
| 2016 | 2017 | 2018 |
| PDF Map GeoTIF Image | PDF Map GeoTIF Image | PDF Map GeoTIF Image |
Here is an EXCEL Spreadsheet containing statistics by town of the extent of forest defoliation for the years 2016, 2017, and 2018.
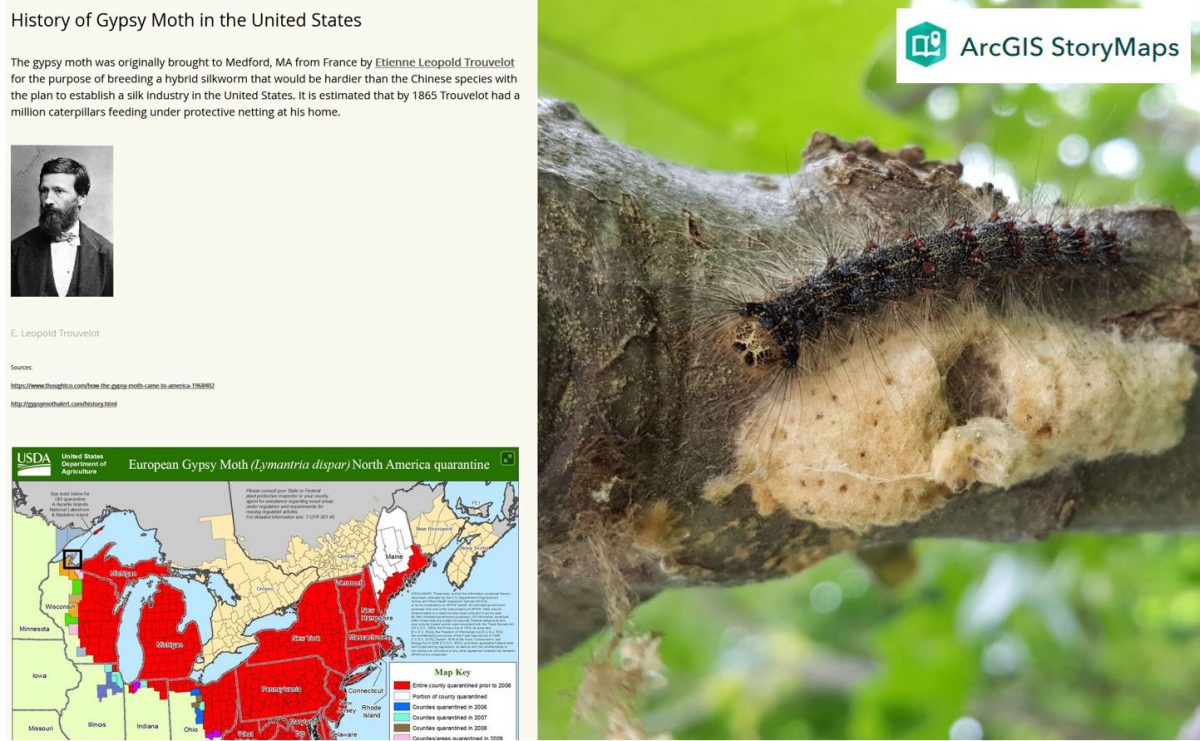
We are working to develop an ESRI Story Map Journal describing the history of Gypsy Moth in the United States and recent forest defoliation impacts in Connecticut.
2016 UNDERGRADUATE STUDENT RESEARCH PROJECT
 Loading...
2015 UNDERGRADUATE STUDENT RESEARCH PROJECTS
Loading...
Loading...