


DISTRIBUTION OF INVASIVE JAPANESE BARBERRY AND MULTIFLORA ROSE IN CONNECTICUT
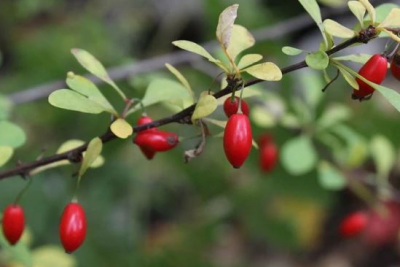

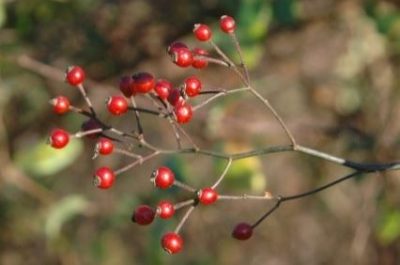

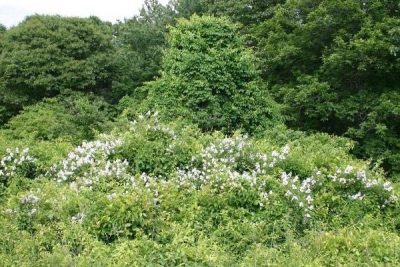
The goal of this study is to determine the value of producing statewide maps for Japanese Barberry (Berberis thunbergii) and Multiflora Rose (Rosa multiflora) utilizing medium resolution satellite imagery from Sentinel-2/Landsat. Early spring is the best period to use remote sensing imagery to monitor both populations, according to their distinctive phenological signals using normalized difference vegetation index (NDVI). With the extended leaf phenology of invasive plants, researchers can distinguish them from native plants before the upper canopy closes using early spring (leaf-off) images.
|
|
|
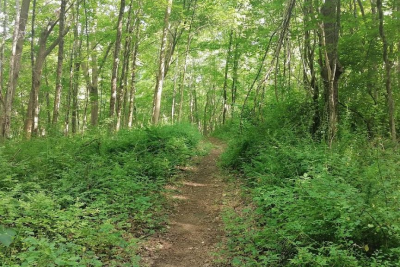
Drone video of UConn Fenton Tract showing understory plants leafing out before the canopy closes in mid-May, 2018. Drone video credit: Dr. Nancy Marek, Founder of BirdHabitatBot. |
In this study, we created a Multinomial Logistic Regression (MLR), which is a machine learning based approach, to map two invasive plant species using Sentinel-2 time series imagery. To train and validate the model, we are working closely with a variety of stakeholders, including Connecticut DEEP (Department of Energy and Environmental Protection), CIPWG (Connecticut Invasive Plant Working Group), UConn forestry extension, UConn agricultural experiment station, land trusts, and other conservation organizations. Maps of invasive plant species will be shared as ArcGIS StoryMaps. A GitHub repository will make training data, machine learning models, and open-source pipelines, available to multiple users.
 |
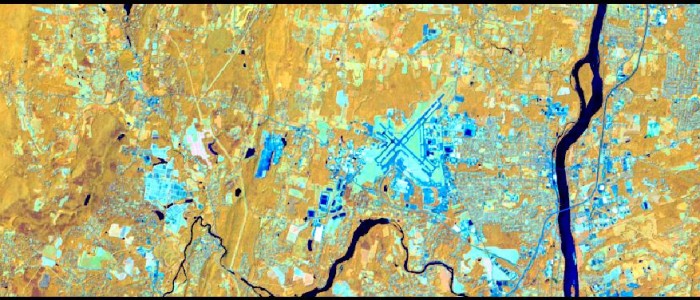
| NDVI map of the UConn Campus in Storrs, CT. Sentinel-2 image acquired on March 23, 2021 |
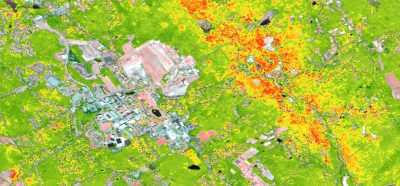
We studied the response of seven vegetation indices, corresponding to 36 study sites, according to the occurrence of three vegetation types during period when invasive shrubs show the extended plant leaf phenology. Training data was built from available scenes from early March to late May. The data consists of Sentinel-2 image scenes acquired from 2018-2023. The objectives of the analysis were to identify: (1) the best time for distinguishing the three vegetation types and (2) which indices would be most important to accurately determine the probability of a pixel being an invasive understory pixel due the spread of Berberis thunbergii or/and Rosa multiflora infestations in Connecticut forests. The Distribution map can be viewed here.
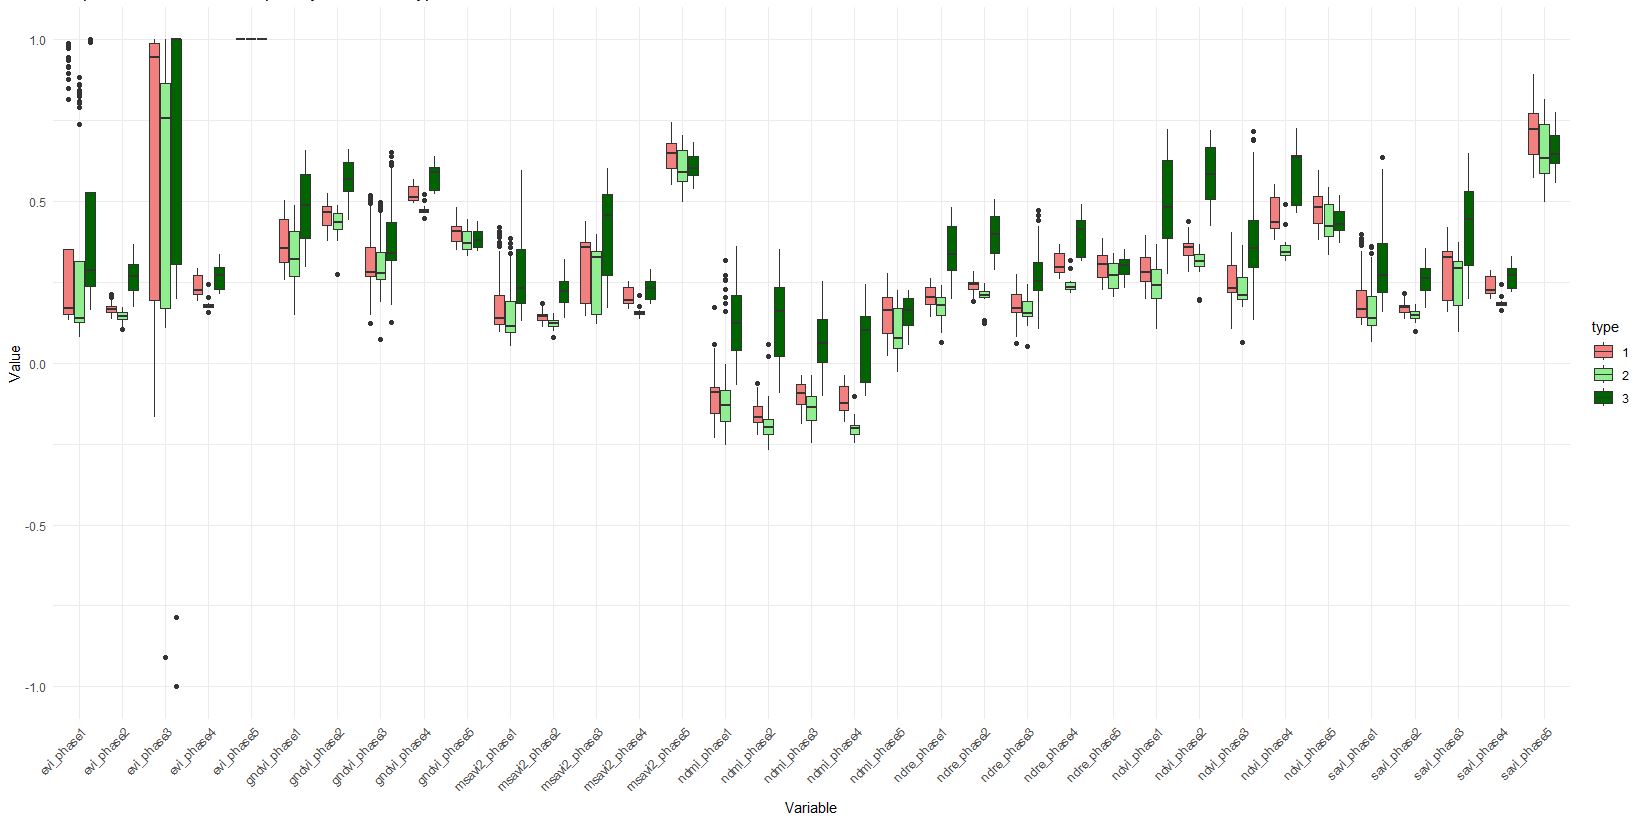 |
| Responses of different vegetation indices for early springtime at the UConn Forest Study Sites. Sentinel-2 BOA values were used to build the boxplots. Class 1 = Invasive pixels, 2 = Deciduous and 3= Evergreen. The time period from early March to Late May has been divided into biweekly phases, which are named from phase 01 to phase 06. |
CONNECTICUT GYPSY MOTH CATERPILLAR FOREST DEFOLIATION 2016, 2017, and 2018
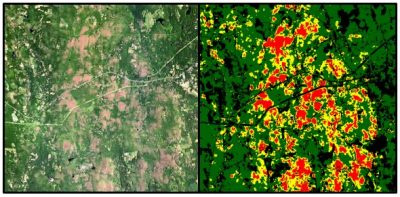
Researchers at ConnecticutView have developed Gypsy Moth caterpillar forest defoliation extent maps for Connecticut for the years 2016, 2017, and 2018. These maps were created through difference analysis of Enhanced Vegetation Indices derived from Landsat 8 and Sentinel-2 satellite imagery.Maps and images may be downloaded in the Research section in the Navigation tabs above.
CONGRATULATIONS
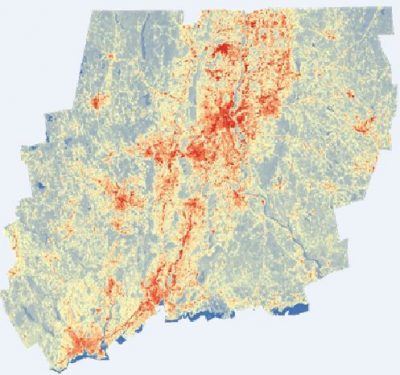
to Zhiyaun Zang, a 2016 ConnecticutView Undergraduate Scholarship receipient on the publication of his paper,”Using Landsat 8 data to compare percent impervious surface area and normalized difference vegetation index as indicators of urban heat island effects in Connecticut, USA“, in the journal Environmental Earth Sciences.
Yang, Z., Witharana, C., Hurd, J. et al. Using Landsat 8 data to compare percent impervious surface area and normalized difference vegetation index as indicators of urban heat island effects in Connecticut, USA. Environ Earth Sci 79, 424 (2020). https://doi.org/10.1007/s12665-020-09159-0
 USGS Land Remote Sensing Program
- An error has occurred, which probably means the feed is down. Try again later.
NASA Earth Observatory
- NASA’s Dragonfly Clears Key Tests as Titan Rotorcraft Takes Shape July 9, 2026
- Erin Urquhart July 9, 2026
- Eleanor Stokes July 9, 2026
- Dr. Ashutosh Limaye July 9, 2026
NOAA National Centers for Environmental Information
- Assessing the Global Temperature and Precipitation Analysis in June 2026 July 9, 2026
- Assessing the U.S. Temperature and Precipitation Analysis in June 2026 July 9, 2026
- Drought Defined: A Deep Dive into the U.S. Drought Monitor June 11, 2026
- Assessing the Global Temperature and Precipitation Analysis in May 2026 June 10, 2026